Core Collapse: The Mathematics of AI Security Asymmetry
Released: 06/16/2026
- The mathematical foundations behind cybersecurity attack-defender asymmetry
- How AI changes attacker and defender capabilities in fundamentally different ways
- The role of Zero Trust and path-deletion boundaries in reducing attack paths
- Why remediation speed and institutional lag are critical security variables
- Practical strategies to reduce vulnerability exposure and improve long-term resilience
Download this Resource
Prefer to access this resource without an account? Download it now.
 Best For:
- Security Architects
- Vulnerability Management Teams
- Zero Trust Architects
- Application Security Professionals
- Risk and Cybersecurity Strategy Leaders
Abstract
The asymmetry between attackers and defenders in cybersecurity is not a failure of tools, processes, or talent. It is structural. This paper presents a scaling model that formalizes how attacker and defender capabilities relate, revealing why attackers inherit a bounded search problem while defenders inherit a combinatorial complexity problem.
This paper started before the release of Mythos and emerged while developing the Core Collapse blog post. While refining those concepts, it became clear that representative mathematical equations could describe the relationships between attackers and defenders, and show how AI would affect each.
The model is conceptual rather than predictive; similar to tools like the Drake Equation, its variables are not directly measurable, and the value lies in showing relationships, not quantitative measurements. The math demonstrates that the attacker has the structural advantage and that the defender’s best lever is to increase attacker complexity through stronger security boundaries. While patching is important, we must defend our way out of this problem, we can’t rely on patching faster than attackers can create and use exploits.
This model explains that AI amplifies attacker efficiency within chosen bounds while exposing a narrower defensive opportunity: AI can shrink the vulnerable surface only when defenders can convert discovery into remediation. The paper concludes with a strategic framework that prioritizes architectural bounding and remediation throughput over tool capability alone, and identifies institutional lag as a key strategic variable and enterprise challenge.
But while this model shows that attackers have advantages today, it shows clear, justifiable pathways to return to equilibrium and even create advantages for defenders in the future. As defenders focus on fundamentals, increasing security boundaries, and use AI themselves to reduce the number of potential vulnerabilities, the math shifts, and the defenders come out on top.
1. Introduction
Attackers enjoy a structural advantage over defenders. This isn’t a failure of tools, controls, talent, or process, though those gaps absolutely exist. The advantage comes from the structure of the problem itself. The math, today, favors attackers. The math, over time, may favor defenders.
An attacker only needs to find one working path to their objective. A defender has to make sure every path to every objective is blocked. Or, more honestly, has to make an informed triage decision about every one of them, knowing the attacker selects from whatever didn’t get the best controls. The attacker solves a search problem in a space they choose. The defender solves a coverage problem in a space they inherit. That asymmetry holds regardless of whether we’re talking about firewalls or AI systems, and most of this paper is an attempt to formalize why.
The emergence of AI in security is amplifying this asymmetry in ways we haven’t yet adequately theorized. AI dramatically improves attackers’ ability to enumerate target options, prioritize high-value paths, and execute within bounded problem spaces. Mythos and Glasswing also show that AI can help defenders discover and fix latent vulnerabilities, and over time that should shrink the surface of newly-introduced flaws. But for now, defender-side AI only changes the structure when defenders can absorb findings and ship fixes. For everyone else, AI mostly accelerates awareness. It doesn’t automatically create isolation, retire systems, or deploy patches.
This paper presents a scaling model to formalize the attacker-defender relationship. Like Lanchester’s laws of combat, Shannon’s channel capacity theorem, or the Drake Equation, this model contains variables that are not directly measurable in practice. The value isn’t in computing exact values. These probably can’t be measured cleanly even in principle! The value is in formalizing how attacker and defender capabilities relate, which way the inequalities point, and what changes the relationship.
The illustrative quantities used throughout (bypass probabilities, multipliers, bounding percentages) are plausible scaling factors grounded in practitioner experience, not empirical measurements. They serve the same purpose as variables in the Drake Equation: they capture relationships that hold across a wide range of specific values. This math doesn’t predict outcomes. It explains why attackers are favored and points at what defenders can actually do about it, which, as we’ll see, mostly means increasing attacker complexity through stronger security boundaries.
The model applies primarily to technical attack paths in enterprise IT environments. Organizational attacks, physical attacks, and supply chain compromise operate under additional constraints that the model can absorb but doesn’t fully treat. The same structure applies equally to identity graphs, OAuth grant topologies, and CI/CD pipelines (substituting roles, tokens, and build edges for systems and network connections). This paper focuses on the big picture, it can’t and does not cover every possible security domain.
The paper proceeds as follows: Section 2 presents the core OR-of-ANDs structure that governs breach probability. Section 3 analyzes attacker problem bounding and how attackers select their target space. Section 4 describes the defender’s combinatorial complexity problem. Sections 5 and 6 introduce the three bounding operators (Transfer, Reduction, Isolation) and three types of boundaries (Path-Deletion, Inline, Detective) that defenders use to shrink their problem. Section 7 addresses the vulnerable surface, knowledge state, and patching dynamics. Section 8 analyzes what AI actually does to both sides of the equation. Section 9 introduces the concept of the vulnerability window and institutional lag. Section 10 connects the model to Zero Trust architecture. Section 11 derives an optimal defensive strategy. Section 12 concludes with strategic implications.
2. The OR-of-ANDs Structure
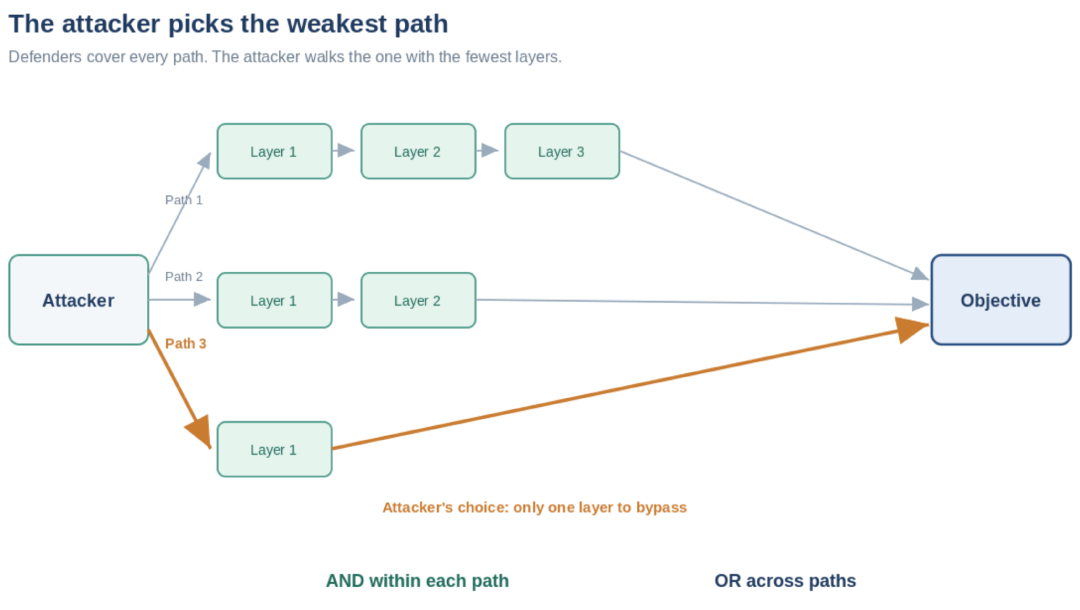
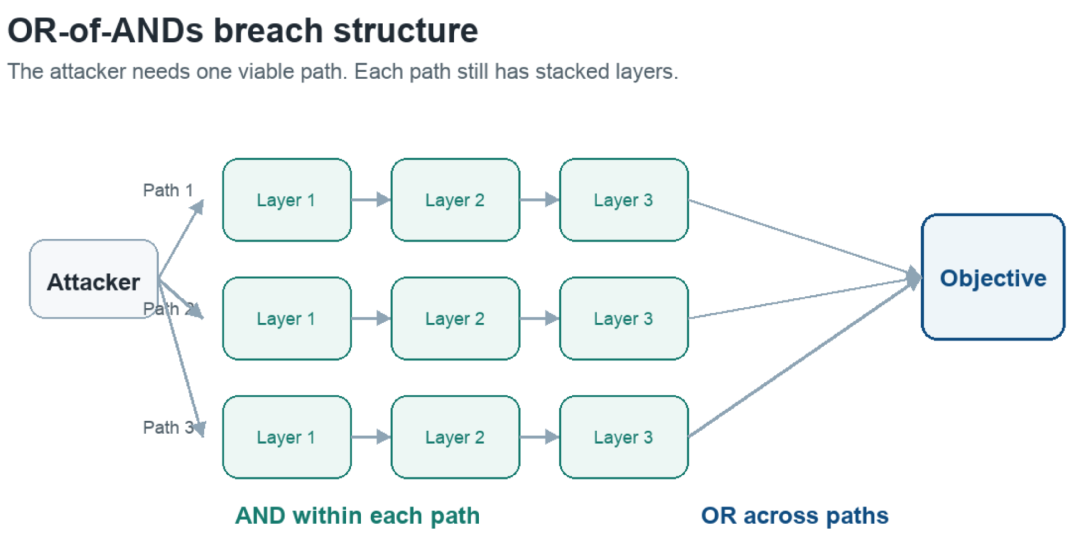
The fundamental structure governing breach probability is the nested product of ORs and ANDs. To reach a given objective o_i, an attacker must find at least one working path through the system. Along each path, they must traverse multiple defensive layers. This creates a mathematical structure that reveals where the asymmetry lies.
The breach probability for a given objective can be expressed as:
P(breach of oi) = 1 − ∏paths (1 − ∏layers bk)
Read this as shorthand, not as something we are trying to calculate precisely.
- o_i is the objective the attacker wants to reach.
- b_k is the chance that defensive layer k can be bypassed.
- ∏ means “multiply across the set.” It is the multiplication version of a summation sign: instead of adding values together, multiply them together.
- ∏_layers b_k means the attacker must bypass every layer on a single path.
- ∏_paths means the defender has to account for every viable path.
- The outer 1 − (…) turns “all paths fail” into “at least one path succeeds.”
The important point is the relationship: layers multiply in ways that help the defender, while paths multiply in ways that help the attacker.
This structure reveals the core asymmetry. The inner product (layers combined with AND) favors the defender. If each layer independently has a 10% bypass probability, then three layers in series reduce the path success probability to 0.1 × 0.1 × 0.1 = 0.001, or 0.1%. Defenses stack multiplicatively. This is the basis of defense-in-depth.
But the outer product (paths combined with OR) favors the attacker. If there are 100 paths to an objective, and each path has a 0.1% success probability, then the overall breach probability is approximately 1 − (0.999)^100 ≈ 0.095, or 9.5%. The attacker only needs one path to succeed. The defender must stop all of them. This is the basis of the path problem.
This structure extends beyond a single objective. Real attacks often target multiple objectives (data exfiltration, lateral movement, privilege escalation), each with their own set of paths and layers. The overall compromise probability follows the same nested structure: multiple objectives (OR), multiple paths per objective (OR), and multiple layers per path (AND). Three of the four levels favor the attacker. Only the innermost (layers along a single path) favors the defender.
A concrete example illustrates the magnitude of this asymmetry. Consider an AWS environment where an attacker seeks to compromise production data. Path 1 is a direct attack: exploit a vulnerability in the production database, bypass the WAF, and exfiltrate data. Assume this requires bypassing: a patched vulnerability (b₁ = 0.0001, high assurance), network segmentation (b₂ = 0.01, moderate assurance), and encryption at rest (b₃ = 0.0001, high assurance). The path success probability is 0.0001 × 0.01 × 0.0001 = 10^-9, or one-billionth. (And let’s be honest, those are very optimistic numbers).
Path 2 is social engineering: compromise a developer’s personal workstation via phishing, gain access to their AWS credentials stored in their browser, and exfiltrate production data. This requires: defeating email security (b₁ = 0.01), defeating endpoint security (b₂ = 0.05), and exploiting the developer’s stored credentials (b₃ = 0.9, high vulnerability because developers often skip MFA on personal machines or reuse credentials). The path success probability is 0.01 × 0.05 × 0.9 = 4.5 × 10^-4, or 0.045%.
The attacker has a choice. Path 1 has a success probability of 10^-9. Path 2 has a success probability of 4.5 × 10^-4. This is a five-order-of-magnitude difference. The attacker selects Path 2. The defender, maintaining both paths, has a combined breach probability of 1 − (1 − 10^-9)(1 − 4.5 × 10^-4) ≈ 0.000450, dominated by Path 2.
This example reveals a critical insight: the defender’s problem is not to minimize the weakest path, but to minimize the path the attacker will actually exploit. And the attacker, with information asymmetry about target configurations, will search until they find that weak path. The defender must secure against the attacker’s best choice, not their own best choice.
The defender must secure against the attacker’s best choice, not their own best choice.
Note the independence assumption: this model assumes paths are independent, meaning compromise of one path does not make compromise of another path easier. In practice, paths share boundaries. Compromised credentials enable multiple paths, successful lateral movement opens multiple objectives, and shared infrastructure creates correlated failures. This weakens strict independence. Correlation complicates the model but does not invalidate it. Shared dependencies can strengthen the attacker, but they can also reveal high-leverage options where one defensive action removes many paths at once. For example, we know that MFA + short session times, device pinning, and egress filtering are shared defenses that work for multiple attack paths. (I described this for data breaches in my 2009 post The Data Breach Triangle).
3. The Attacker Problem: Bounded Search
| An attacker operates with a selection function. Let D represent the full resource space: all systems, services, data repositories, user accounts, and infrastructure components in the target organization. An attacker with finite capabilities chooses a subset s from D where ** | s | << | D | **. The attacker focuses their efforts on a small, carefully selected portion of the larger resource universe. |
This is fundamentally a search problem: given a resource space D and a time budget t_a, find one subset s such that the optimal path through s is exploitable with probability greater than some threshold. The key insight is that the cost of selection is essentially zero. The attacker spends time enumerating potential targets, analyzing their configurations, and selecting the subset s with the highest expected breach probability. But enumeration and analysis are nearly free. A single engineer or automated tool can conduct reconnaissance on thousands of targets in seconds. Implicit in this is the attacker’s optimization: they are maximizing expected utility under a cost-of-selection function, and the AI claim later in this paper is essentially that AI drives the cost of selection toward zero.
This leads to a distinction between two attack strategies: differentiated attacks and undifferentiated attacks.
Differentiated attacks involve deep reconnaissance on a small number of targets. An attacker spends weeks or months analyzing a specific organization, mapping their network, identifying key personnel, discovering misconfigurations, and finding zero-day vulnerabilities specific to their infrastructure. The selection is expensive in time and expertise, but the resulting subset is highly exploitable.
Undifferentiated attacks involve spray-and-pray reconnaissance. An attacker sends phishing emails to thousands of organizations, exploits a recently disclosed vulnerability in widely deployed software, or conducts port scanning against millions of IP addresses. The selection is minimal; the attacker is not optimizing for any specific target. But the volume is enormous, and they only need one target to succeed.
Classically, there was a sharp distinction between these two approaches. Differentiated attacks required expensive expertise and returned high-quality leads. Undifferentiated attacks required cheap automation and returned low-quality leads. Organizations could invest in controls that favored either defense against targeted attacks (attribution-based, intelligence-driven response) or attacks of opportunity (hygiene, patching, endpoint security).
AI weakens this distinction. Machine learning models can perform reconnaissance at scale, identify vulnerable configurations in thousands of targets, extract technical signals from reconnaissance data, and prioritize the most exploitable subsets. This is closer to differentiated quality at undifferentiated scale, although not for free. Effective targeting still requires context, scaffolding, delivery infrastructure, and validation. The attacker advantage is that those investments can be reused across many bounded searches.
| The attacker’s selection problem becomes: given a budget to analyze n targets and a model that scores configurations for exploitability, identify the subset s that maximizes expected breach probability. AI makes this search faster and more accurate, increasing ** | s | ** without a proportional increase in cost. The attacker’s problem space shrinks further. |
4. The Defender Problem: Combinatorial Complexity
The defender faces a fundamentally different problem. Where the attacker can freely select s, the defender must account for all of D, even though they do not protect each asset equally. This is a combinatorial complexity problem: paths, objectives, and defensive layers multiply against each other, and every meaningful path to every meaningful objective requires defensive attention. A low-value system can get less control, but it cannot be ignored if it leads to identity, data, or operations. Systems they consider low-risk may harbor undetected vulnerabilities. Services they plan to deprecate may persist in production for years.
Defenders prioritize. Crown-jewel systems get the strongest controls; commodity systems get baseline hygiene; some risks get explicitly accepted. That’s necessary. It’s how finite security teams handle infinite-feeling problems, and any honest reading of the coverage problem has to start with it. But prioritization allocates defensive resources across D; it doesn’t remove paths from D. An attacker who lands on a deprioritized asset still has a path. Worse, deprioritized assets often connect to the very systems that received the most defense. A forgotten S3 bucket leads to identity, a stale admin workstation leads to the production console, an abandoned subdomain leads to a session token. The same correlation that creates high-leverage defensive cut-sets (Section 2) also creates high-leverage attacker pivots, and the attacker is the one choosing where to look. The structural asymmetry doesn’t disappear with prioritization; it just shifts to whatever the defender decided to look at less carefully. Prioritization is necessary. It isn’t sufficient.
The defender’s problem can be characterized by coverage density: the ratio of defensive resources allocated to the resource surface that must be defended. As a scaling intuition:
g(D) = Rd / D
Read this as:
- g(D) is coverage density: the amount of defense per unit of defensive surface.
- R_d is the defender’s total resource investment.
- D is the size of the resource space: systems, services, data repositories, accounts, and infrastructure components.
The realistic version is per-asset because defensive resources concentrate where assets carry weight, but the aggregate g still illustrates the dynamic.
As D grows, maintaining constant g(D) requires R_d to grow proportionally. But in most organizations, R_d grows sublinearly with D. New systems are deployed without proportional increases in security staffing. New cloud services are adopted faster than IAM controls are built. Attack surface expands while defensive resources stagnate. The defender’s coverage density g(D) declines over time.
This decline has real consequences. Lower coverage density means fewer systems receive regular security updates, less detailed monitoring, weaker access controls, and longer mean time to detect. The defender’s problem is not just unbounded; it is growing faster than the defender’s capacity to bound it.
That is, unless defenders automate. We’ll get there.
Defenders are squeezed two ways. The budget is finite, and within that budget every dollar competes against five other priorities: a new cloud migration, a vulnerability management program, staff training, incident response, compliance, technical debt. At scale, you rarely get more than one big thing at a time. Meanwhile, defensive resources have to spread across building new controls, maintaining the controls already in place, and reacting to whatever incident is on fire this week.
| The defender’s problem scales not just with ** | D | **, but with ** | D | ** multiplied by the path count P. Each additional system adds not just one target for attack, but multiple new paths to existing objectives. A misconfigured S3 bucket isn’t just a storage vulnerability. It’s a lateral movement vector, a data exfiltration path, and a credential compromise risk. The problem space isn’t additive; it’s multiplicative. |
The problem space isn’t additive; it’s multiplicative.
Furthermore, the defender cannot freely choose which parts of D to defend. Business requirements dictate that certain systems must be accessible. Legacy applications must continue running because replacing them would cost more than defending them. Third-party integrations must be maintained because they deliver business value. The defender cannot unilaterally decide that a system is not worth defending; they can only argue for its deprecation. That process requires stakeholder consensus and typically takes years.
The Supply Chain Extends the Mathematical Asymmetry
The defender’s coverage problem extends well beyond systems they directly operate. Modern software depends on layers of open source libraries, packages, and frameworks, each of which introduces paths into the defender’s attack graph that the defender did not create and often cannot fully control. A typical enterprise application may pull in hundreds of transitive dependencies, each maintained by independent projects with varying security practices. The defender’s effective resource space D includes their own infrastructure plus the privileged dependency graph that builds, ships, and runs their software.
This creates a structural asymmetry that the OR-of-ANDs model captures precisely. The attacker’s search problem is bounded: identify and compromise one or more widely used open source projects. A single compromised package that appears in thousands of dependency trees can give the attacker paths into thousands of organizations simultaneously. The attacker selects a small subset s of the open source ecosystem (projects with high downstream adoption, limited maintainer resources, or weak publishing controls) and focuses their effort there. Their search space is small and well-defined.
The defender’s coverage problem is not to prove every open source project is clean. That is impossible and the wrong model. The real problem is to identify reachable dependencies, understand build-time and runtime privileges, and bound the paths they create. SBOMs, package pinning, signed artifacts, provenance, sandboxed builds, runtime isolation, and dependency reduction all help. The attacker needs one useful dependency path. The defender needs to prevent dependency compromise from becoming business compromise.
Recent events demonstrate that attackers are intuitively exploiting this mathematical advantage. A wave of software supply chain attacks illustrated the pattern: compromised packages in popular open source registries propagated malicious code through dependency chains, affecting organizations that had no direct relationship with the compromised projects. Techniques included typosquatting on popular package names, injecting malicious code into legitimate packages through compromised maintainer accounts, and planting sleeper payloads designed to activate after widespread adoption. In some cases, compromised libraries included self-propagation mechanisms that attempted to inject malicious code into other packages built on the same development system.
While not every supply chain attack to date has definitively involved AI, the model predicts that AI will accelerate this vector. AI reduces the cost of the attacker’s bounded search: automated analysis of package registries to identify high-value targets, AI-generated code contributions that pass cursory review, and agentic systems that can manage multiple concurrent compromise campaigns. The same erosion of the differentiated-versus-undifferentiated distinction described in Section 3 applies directly to supply chain targeting. An attacker can conduct precision reconnaissance on the open source ecosystem at commodity scale.
For defenders, the supply chain problem compounds institutional lag. Even when a supply chain compromise is discovered, the remediation path is long: identify all affected systems, determine which transitive dependencies pull in the compromised package, test replacement versions, and deploy updates across the organization. Each step is subject to the same τ_d constraints described in Section 9. Organizations below the security poverty line face an even harder version of this problem. They often lack comprehensive SBOMs and have no reliable visibility into their own dependency trees. In this model, supply chain risk is where bounded attacker search and risk-weighted defender coverage collide most violently.
5. Problem Space: The Three Bounding Operators
The defender’s coverage problem is structural. It can’t be solved by better detection alone, faster response alone, or smarter tools in isolation. The durable way to reduce breach probability is to structurally reduce the problem space. Defenders have three mechanisms to bound their problem: Transfer, Reduction, and Isolation.
The durable way to reduce breach probability is to structurally reduce the problem space.
Transfer (T)
Transfer moves resources to managed platforms where the provider assumes defensive responsibility. Moving applications to cloud infrastructure (IaaS), adopting SaaS applications, or using managed databases partitions D into D_self (resources the organization manages) and D_ext (resources the provider manages). The organization no longer maintains the infrastructure layer, the OS security patches, or the database hardening.
Transfer does not eliminate the problem; it relocates it. It trades local complexity for dependency risk. An organization that eliminates 50 on-premises servers by moving to managed cloud infrastructure still depends on the provider’s security. A provider compromise, misconfiguration, or breach can still affect the organization. The organization also inherits the provider’s patch cycles, security policies, and incident response procedures, which may not align with organizational risk tolerance.
Transfer today is constrained mostly by cost, the complexity of migration, and, for the most sensitive workloads, the need for compensating controls when you don’t fully trust the provider. The result for the model is the same: D_self never shrinks to zero, and D_min (the minimum viable resource set that has to stay under direct organizational control) acts as a lower bound.
Transfer also transforms the risk, not just its location. When you transfer to a managed platform, you don’t just hand off a slice of D. You join the provider’s entire customer base, and you inherit the attacks aimed at it. Part of that is direct multitenant risk: a provider compromise or an isolation failure can reach many customers at once. Not every provider breach crosses tenant boundaries, but enough do (especially across the larger SaaS ecosystem) that it stays on the list.
The larger effect is undifferentiated. Most cloud attacks don’t begin by picking you. They begin by sweeping the whole ecosystem for the cheapest way in, and in the cloud that still overwhelmingly means exposed credentials and publicly-facing resources, not exotic exploits. Attackers pivot to a targeted approach only after they find something worth the effort. In 2024 Chris Farris and I described this in the Universal Cloud Threat Model. That’s the real middle-of-the-pack problem: you’re rarely unique enough to be singled out, but never anonymous enough to sit outside the sweep. Transfer puts you on that shared, constantly-scanned surface. It doesn’t subtract from the attacker’s options. For the undifferentiated majority of attacks, it adds you to a much larger target list, though the right provider can also convey collective-defense advantages.
Reduction (R)
Reduction is the only operator that actually shrinks D. It requires retiring systems, decommissioning services, and removing infrastructure components from production. A system that is retired no longer needs to be secured, monitored, or patched. Its attack surface is eliminated.
Reduction is constrained by D_min, the minimum viable resource set that the organization needs to operate. An organization can’t reduce below this threshold without compromising core operations. D_min varies by organization, but is typically substantial: email systems, identity management, file storage, business applications, and operational databases are rarely candidates for elimination.
More critically, reduction velocity is extremely low. Most organizations are growing (adding new systems, services, and infrastructure) faster than they retire legacy systems. The reduction operator gets overwhelmed by the influx of new D. In practice, technical debt piles up: unsupported systems, deprecated applications, and orphaned infrastructure that should be retired but persist because nobody has authority to shut them down.
Reduction is the single most underappreciated and underutilized option.
Isolation (I)
Isolation decomposes the resource graph into zones with controlled connectivity. Rather than reducing the number of resources, isolation reduces the number of paths between resources. A segmented network where production systems are isolated from user workstations, where customer data is isolated from administrative infrastructure, and where legacy systems are isolated from modern applications dramatically reduces the attack graph. Isolation can even extend to tiers within a single application, and boundaries within the application code itself, providing more friction when trying to move between layers or services.
If an organization has N systems and full connectivity (mesh topology), the number of potential paths is approximately N². Isolation creates a sparse topology. If isolation groups the N systems into k zones with limited inter-zone connectivity, the path count is reduced to roughly k² plus internal paths. For a large organization, this represents orders of magnitude reduction in the attack graph.
Isolation is the most expensive operator to implement. It requires architectural redesign, network equipment (or SDN reconfiguration), application modifications (many legacy applications assume flat network topology), code level refactoring (especially for monolithic applications), additional identity boundaries (and the corresponding increase in nonhuman identities), and ongoing maintenance. An organization must redesign authentication flows to work across zones, implement API gateways and service proxies, and reconfigure systems that expect direct connectivity. Isolation requires both capital investment and architectural expertise.
Long term, this is the best option for resilient defense.
The Three Operators in Combination
In practice, defenders apply all three operators simultaneously, though they don’t commute. T-then-I produces a different result than I-then-T, because each pass changes what the next operator sees. An organization might transfer non-core applications to SaaS (T), retire legacy systems (R), and implement network segmentation (I) to reduce their problem space. Even aggressive application of all three leaves a substantial residual.
In my consulting experience, mature organizations that aggressively apply Transfer, Reduction, and Isolation often bound their problem to roughly 40–50% of the original surface. I’ve seen these improvements mostly during cloud migrations that adopt cloud native patterns. As with everything in this model, treat that number as a scaling intuition, not a measurement. It’s an observation from working with mature organizations over two decades, not a validated industry-wide figure.
A 10% reduction can matter more than a 50% reduction if it removes identity paths to crown-jewel systems. The remaining problem is the irreducible core: systems that can’t be eliminated, can’t be transferred, and can’t be fully isolated without breaking business operations. AI-assisted vulnerability discovery may help identify retirement candidates and segmentation boundaries, but the structural constraint persists regardless of tooling.
Each operator also has implementation lag. Transfer requires vendor selection, contract negotiation, architecture design, migration execution, and validation, typically taking months. Reduction requires decommissioning planning, data retention verification, stakeholder sign-off, and system shutdown, also months to years depending on criticality. Isolation requires architectural analysis, network design, implementation, testing, and training, often years for enterprise-scale organizations.
6. Three Types of Boundaries
The bounding operators restructure the problem space. Within that space, defenders also deploy boundaries that act on individual paths. These boundaries have different mathematical properties and different operational characteristics.
Path-Deletion Boundaries (I-type)
Path-deletion boundaries do exactly what the name says: they remove edges from the attack graph. They don’t make paths harder. They remove specific routes from the map. A network segmentation rule that prevents user workstations from connecting to production databases removes that network path. Zero Trust network access controls that block all connections except explicitly allowed flows transform the attack graph from mesh to sparse graph.
That doesn’t make path deletion magical. Modern environments have network edges, identity edges, API edges, CI/CD edges, secrets edges, OAuth grant edges, and SaaS control-plane edges. Deleting one doesn’t necessarily delete the others. A network path can be eliminated while an IAM role, OAuth grant, or workload identity still leaves a route to the same objective. In practice, a path-deletion boundary is only effective when it removes all relevant edges for that path, and the work of finding them is rarely complete the first time.
Misconfigurations and forgotten exceptions also recreate supposedly deleted paths. The diagram says deleted; the runtime says still reachable. Continuous validation matters here more than the original implementation. Breach-and-attack simulation, attack-path graphing, drift detection, and routine red-team testing are how you find out whether a path that was supposed to be gone actually is. A path-deletion boundary that isn’t continuously verified eventually becomes an inline boundary with extra steps.
Inline Boundaries (L-type)
Inline boundaries make existing paths harder to exploit. They don’t eliminate paths; they reduce the probability that an attacker can traverse them. Firewalls, authentication systems, endpoint detection and response (EDR), IAM, encryption, and access controls all operate as inline boundaries. They sit along the attack path and enforce checks the attacker must bypass.
Inline boundaries are multiplicative along each path. If three inline boundaries are deployed along a single attack path, the overall bypass probability is the product of individual bypass probabilities. This is the “Swiss cheese model” of security: each boundary has holes, but overlapping holes should be rare. The model holds when boundaries are independent, meaning compromise of one boundary does not compromise another. In practice, boundaries share failure modes (a single zero-day can bypass multiple layers; compromised administrative credentials can disable multiple boundaries). Independence isn’t strict, but the multiplicative structure mostly holds.
Detective Boundaries (D-type)
Detective boundaries are a third category of defense: deception networks, honeypots, and canary tokens that create decoy resources and paths indistinguishable from real assets. When an attacker traverses a detective boundary, they trigger detection rather than accessing the real asset.
Detective boundaries are unique because they operate at the OR level of the attack graph. Traditional inline boundaries tax the AND level by making a single path harder. Detective boundaries tax the OR level by increasing the attacker’s search cost through false paths. The strength of that tax depends on how the attacker enumerates. If 20% of enumerated targets are honeypots, a naive random search only increases expected draws to hit a real target from 1 to 1.25, not 5. Their real value comes when decoys force validation cost, create uncertainty, or trigger detection before the attacker distinguishes fake from real.
Detective boundaries don’t require architectural change. They can be deployed on existing infrastructure as a bridge while structural bounding (Transfer, Reduction, Isolation) is planned and implemented. A honeypot database can be deployed in existing infrastructure. Canary tokens can be placed in shared documents. Service account tokens can be seeded in decoy locations. These defenses create friction in the attacker’s selection and enumeration phases, elevating the cost of reconnaissance without requiring infrastructure redesign.
Detective boundaries degrade over time if not maintained. As an attacker learns which resources are honeypots and which are real, the decoy advantage diminishes. Public honeypot datasets, security research, accumulated attacker knowledge, and AI-assisted fingerprinting all reduce the effectiveness of generic deception strategies. Detective boundaries require ongoing maintenance and variation to stay effective.
7. The Vulnerable Surface
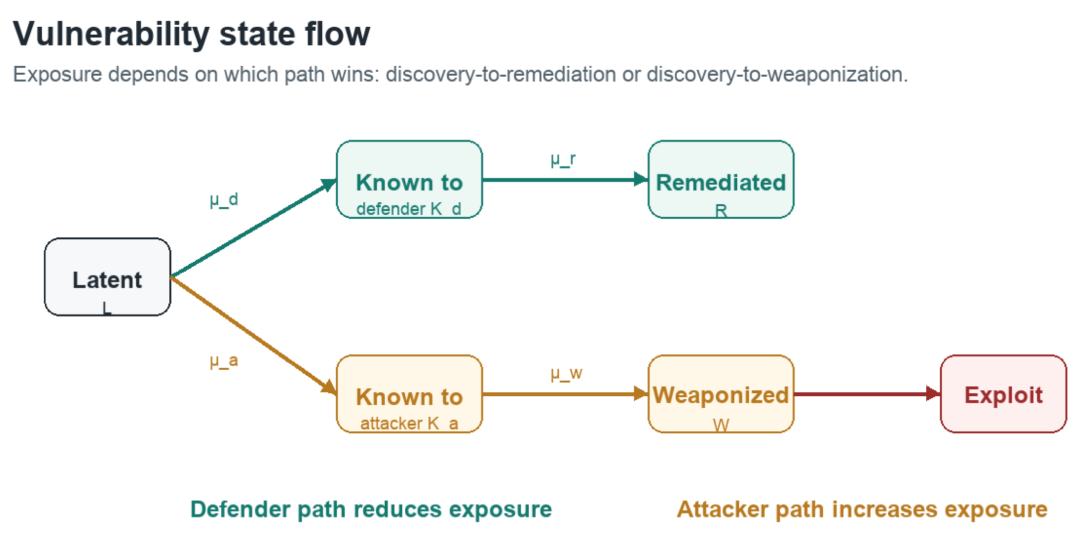
Within D there exists a set L of latent exploitable flaws: unpatched vulnerabilities, misconfigurations, weak credentials, insecure defaults, and unsafe trust relationships. These flaws exist whether anyone has discovered them or not. Discovery doesn’t create vulnerability. It changes who knows.
It’s useful to split the vulnerable surface into states. Call L the latent set, K_d the vulnerability known to defenders, K_a the vulnerability known to attackers, W the weaponized vulnerability, and R the remediated vulnerability. The flows that matter are L → K_d and L → K_a (discovery), K_d → R (remediation), and K_a → W → exploitation. The actual risk depends on the relative speeds of those flows. If μ_d, μ_a, μ_w, and μ_r are the rates of those transitions, the fraction of latent bugs that attackers learn about first works out to roughly μ_a / (μ_a + μ_d). In plain English: the question that determines exposure isn’t whether the bug exists. It’s who finds it first, and what they can do once they find it. The transition rates are no more measurable than the other variables in this paper. What matters is the direction AI tooling moves them.
The question that determines exposure isn’t whether the bug exists. It’s who finds it first, and what they can do once they find it.
The aggregate dynamics can still be written as a differential equation:
dVe/dt = −α Ve + ν
Read it this way:
- V_e is the exploitable vulnerability that remains unremediated and useful to attackers, roughly the portion of K_a (vulnerability known to an attacker) that hasn’t yet been moved to R (remediation).
- dV_e/dt is the rate of change in that exposure over time.
- ν is influx: new flaws being born into the codebase, plus existing latent flaws crossing into K_a as attackers discover them.
- α is remediation: defenders moving vulnerabilities they know about from K_d into R.
- The minus sign matters. Remediation drains V_e while influx refills it.
At steady state, the system reaches a balance point where dV_e/dt = 0:
Ve* = ν / α
Here, V_e* is the steady-state level of effective vulnerability. Read the ratio conceptually: ν pushes exposure up because new exploitable vulnerability keeps entering the system, while α pulls exposure down because defenders are moving known vulnerabilities into remediation. If ν rises faster than α, steady-state exposure grows. If α rises faster than ν, steady-state exposure falls.
The equation reveals a structural point: as long as new exploitable vulnerability keeps entering the system, effective vulnerability can never reach zero. No matter how aggressively you patch, steady-state exposure is determined by the ratio of influx to remediation. The ratio framing is what the model is good at; the specific values aren’t. Two organizations with the same ν / α ratio will have similar exposure shapes even if their absolute numbers differ by orders of magnitude.
The equation reveals a structural point: as long as new exploitable vulnerability keeps entering the system, effective vulnerability can never reach zero. No matter how aggressively you patch, steady-state exposure is determined by the ratio of influx to remediation. The ratio framing is what the model is good at; the specific values aren’t. Two organizations with the same ν / α ratio will have similar exposure shapes even if their absolute numbers differ by orders of magnitude.
The catch is that this trend mostly applies to software that gets reviewed. The existing base of legacy and embedded software (the systems an enterprise actually runs) won’t benefit at the same rate. A vendor-abandoned ERP, a manufacturing controller running on a kernel from a decade ago, a custom Java application where the original developer left in 2014: those don’t get retrofitted to memory-safe languages or formally verified, because the patch breaks the dependent applications. The ν reduction is forward-looking. The legacy ν stays roughly where it was, and the legacy vulnerable surface will keep being part of the problem for a long time.
Remediation velocity α is bounded. Even the best-resourced teams don’t patch everything immediately. They validate reports, test fixes, manage downtime, and coordinate releases. As an illustrative range, high-maturity organizations may remediate most critical issues inside 30 days and high issues inside 90 days; typical enterprises fall well below that depending on asset type and ownership. The remainder is delayed by testing, approval processes, operational risk, or technical barriers.
Technical debt further constrains remediation. Many systems in production cannot be patched because the patch breaks dependent applications. A legacy ERP may not support the latest OS patches due to vendor abandonment. A specialized manufacturing control system may have a firmware vulnerability that can’t be patched without industrial downtime. These systems remain perpetually in the effective vulnerable surface because the cost of patching exceeds the acceptable downtime.
The attacker’s problem is simplified by the reachable portion of V_e. Known exploited vulnerabilities, public proof-of-concept code, leaked credentials, exposed services, and misconfigurations are attractive because they reduce search cost. The defender’s goal isn’t to eliminate every latent flaw. It’s to shrink the useful, reachable, weaponizable part of the graph before attackers convert it into a path.
8. What AI Does to the Equation
Artificial intelligence is changing cybersecurity, but not in the ways often claimed. The useful distinction is between improvements that change scale, improvements that change structure, and improvements that just change who knows what first.
AI’s Effect on Attackers
For attackers, AI provides improvements across multiple dimensions that compound multiplicatively.
First, AI raises the attacker floor. The hardest thing to acquire in offensive security has always been skill: the experience to read an unfamiliar environment, chain a working exploit together, and improvise when something breaks. AI compresses that. A low-skilled attacker working with a capable model now operates much closer to an expert, possibly even world-class when using the right model. They can draft working exploit code, interpret reconnaissance they wouldn’t have understood on their own, and get unstuck without a mentor. This doesn’t just make existing attackers faster. It enlarges the population of attackers who can run a competent campaign at all. In the model’s terms, more actors can now execute a credible search, which means more independent draws against every defender.
Second, AI improves the selection function. Attackers can now automatically identify vulnerable configurations in thousands of targets, extract technical signals from reconnaissance data, and prioritize high-value objectives. This collapses the practical distinction between differentiated and undifferentiated attacks, enabling precision targeting at scale.
Third, AI improves efficiency within the chosen problem space. Attackers can use swarms of agents to automate aspects of reconnaissance, vulnerability discovery, exploit development, and even social engineering. What previously required human expertise can now be automated, letting a single attacker run simultaneous campaigns against hundreds of targets.
Fourth, AI enables the attacker’s continuous operation. Large language models can draft convincing phishing messages, automatically generate malware variants to evade detection, and adapt tactics in real time based on defender responses. What previously required an attacker to actively monitor and adjust can now be automated, reducing operational cost.
These improvements compound rather than add. Better selection, faster execution, and continuous adaptation amplify a single attacker’s advantage multiplicatively: if AI improves selection efficiency by 10× and exploitation efficiency by 5×, the compound effect is a 50× improvement in capability, not 15×. The multipliers are representative, not measured. The structural point is that improvements in selection and exploitation compound rather than add. And the higher floor multiplies the problem again at the population level: those compounded gains now accrue to far more attackers than before.
Early evidence suggests these illustrative figures may understate reality. RAPTOR, an open-source framework released in late 2025, turns a publicly available coding agent into an offensive security operator that generates working exploits for known vulnerabilities through an agentic workflow (the same framework also generates patches). A 2026 update added a validation step that makes the agent reason about realistic attacker capability before committing effort, which is the selection function from Section 3 showing up in a tool anyone can download.
Capability that used to require a skilled exploit developer now ships as open source. These improvements still require scaffolding, target context, validation, and delivery infrastructure, and the attacker advantage is that they can reuse that infrastructure across many bounded searches. Even that residual cost is eroding: Anthropic’s Mythos model is reported to dramatically reduce the scaffolding a capable attack requires.
AI’s Effect on Defenders
Defenders get two kinds of AI improvement. The first is operational. The second is structural.
The operational category is well established. Machine learning can analyze massive volumes of security events, correlate signals, and surface anomalies that humans would miss. Large language models can also identify anomalies, analyze logs, find misconfigurations, help security analysts understand threat reports, generate response playbooks, and accelerate incident investigation. These are real improvements to operational capability, but they’re improvements to inline boundaries (L-type) or detection (D-type). They make existing paths harder to exploit and faster to detect. They do not reduce D, the overall resource space that must be defended. They do not create path-deletion boundaries.
The structural category is the newer one. In April 2026, Anthropic’s Project Glasswing and Claude Mythos Preview showed that frontier AI models can discover and reproduce serious vulnerabilities at scale, including a 27-year-old OpenBSD bug and a 16-year-old FFmpeg flaw. Mozilla reported that Mythos identified 271 Firefox security vulnerabilities, all fixed in Firefox 150. This is not just better detection. In the state-model terms of Section 7, AI-assisted discovery moves latent flaws from L into K_d and then into R before attackers move them into K_a and W. For software producers with patch pipelines, that can shrink V_e. The same logic applies to AI-assisted code review, secure-by-default IaC generation, automated misconfiguration remediation, and over a longer horizon, the shift to memory-safe languages and formally verified components, all of which reduce ν at the source.
The gap between discovery and remediation is the binding constraint. Mozilla is a software producer with modern CI/CD pipelines, automated testing, and rapid release cycles designed for continuous patching. When they receive 271 vulnerability reports, they can integrate fixes into their next release in weeks. That’s fundamentally different from the situation facing a typical enterprise consumer: decades of legacy software, a mix of commercial off-the-shelf products they can’t modify, and custom applications that were never built with modern DevOps practices. For these organizations, and especially for those below the security poverty line, AI-assisted discovery does not translate into faster remediation because the bottleneck was never finding the vulnerabilities. The bottleneck is institutional capacity to act on what is found.
Who “the defender” is matters here, and the producer-versus-consumer contrast above is really a four-way distinction. Software producers with modern CI/CD (Mozilla, major SaaS vendors, the better-resourced parts of the OSS world) can integrate AI-assisted discovery directly into the development pipeline and convert findings into shipped fixes in days or weeks. Platform providers like hyperscalers, identity providers, and major shared infrastructure can reduce risk across many tenants simultaneously, but the same concentration creates systemic exposure when something on their side breaks. Enterprise consumers can patch, isolate, configure, and monitor, but typically can’t fix root-code defects in software they didn’t write. Open-source maintainers usually own the code but rarely have the time, funding, or release machinery to absorb a flood of AI-generated findings. The structural benefit of defender-side AI is concentrated in the first two roles. The third gets faster awareness. The fourth often can’t keep up with the flow of findings.
Early data from the broader Glasswing initiative underscores this point: fewer than 1% of the vulnerabilities discovered across participating organizations were patched in the initial evaluation period (we don’t know what percentage were deemed exploitable or high priority). Discovery happened at machine speed. Remediation happened at calendar speed, constrained by the same institutional lag (τ_d) that this model identifies as a key strategic variable. Discovery is necessary but not sufficient. Execution remains the binding constraint for defenders. Even when patches are auto-generated and auto-tested, auto-testing at scale under different circumstances will always require a window.
AI can also help defenders discover where to apply Transfer, Reduction, and Isolation. A vulnerability scanner can identify retirement candidates. Network and identity analysis can map dependencies and surface high-leverage cut sets. But the core structural changes remain constrained by institutional lag. They require vendor selection, architecture design, change management, and stakeholder coordination. AI can’t negotiate contracts, retire legacy ERP, or make a change board accept operational risk. A SOC powered by AI can respond to incidents 10× faster, but that doesn’t help an organization still running 500 legacy systems that should have been retired a decade ago.
The net effect: AI’s improvements to defense are real but structurally constrained. Organizations that have already compressed τ_d (mature DevOps practices, automated testing, streamlined change management) can leverage AI-assisted discovery to achieve genuine structural reduction of their effective vulnerable surface. Organizations that haven’t compressed τ_d gain faster awareness but not faster remediation. The asymmetry persists: AI gives attackers differentiated quality at undifferentiated scale with low deployment lag, while defenders gain powerful new capabilities that remain bottlenecked by institutional capacity to act.
9. The Vulnerability Window and Institutional Lag
Every time attacker or defender capabilities advance, a vulnerability window opens. The attacker adapts in time τ_a, typically days to weeks. The defender executes structural response in time τ_d, unfortunately this is often months to years. The excess risk that accrues in the interval [τ_a, τ_d] represents the strategic vulnerability of the organization.
Consider a concrete example. A new critical zero-day is disclosed in a widely deployed application. At t=0, the defender learns of the vulnerability. The attacker begins exploitation immediately. In practice, attacks often start hours after public disclosure. The defender’s response requires multiple steps:
- τ_eval: Evaluation and triage (hours to days). Does this apply to our environment? What is the risk? What is the remediation path?
- τ_procure: Procurement (hours to days). If a patch is needed, obtain it. If a workaround or mitigation is needed, acquire the tools or services.
- τ_integrate: Integration and testing (days to weeks or even months). Test the patch in non-production. Verify compatibility with dependent applications. Validate the fix.
- τ_test: Change control and approval (days to weeks). Obtain authorization to deploy. Notify stakeholders. Schedule deployment.
- τ_deploy: Deployment (hours to days). Roll out the fix across the infrastructure. This is staged because patching production systems all at once risks availability issues.
- τ_train: Training and validation (heat death of the universe). Ensure staff understand the remediation and monitor for adverse effects.
For a critical vulnerability in the datacenter, the total τ_d is roughly 30–100 days, with an average around 60 days. The attacker is actively exploiting within 1–7 days. The vulnerability window is [1–7 days, 60 days], an interval of 50+ days where exploitation is occurring and defenses are still being deployed.
These timelines vary greatly based on the organization and the application stack. Serverless and containerized applications running via modern CI/CD in cloud might be easily updated within hours, while legacy apps installed by hand might take months or years to update.
The excess risk integral quantifies this gap:
Rexcess = ∫τdτa ΔR(t) dt
Read this as:
- R_excess is the extra risk accumulated during the vulnerability window.
- τ_a is when the attacker can start using the new capability or vulnerability.
- τ_d is when the defender’s response is effectively deployed.
- ΔR(t) is the additional risk at a particular time t because the vulnerability is still exploitable.
- ∫[τ_a, τ_d] means “add up that extra risk across the whole window.”
- dt is the small slice of time being added up inside the integral.
The simple form treats τ_d as a clean endpoint. In practice, exploitation continues against unpatched systems past τ_d as the rollout staggers and ΔR(t) decays over time. That more detailed version is more honest, but the simple form is enough to make the structural point.
This leads to an important point about throughput: reducing τ_d by one month provides more risk reduction than improving any single defensive boundary by a small percentage. An organization that accelerates its patching timeline from 60 days to 30 days eliminates half the vulnerability window. An organization that reduces individual boundary bypass probabilities from 1% to 0.5% (a 50% improvement) might reduce breach probability from 10% to 5%. The first is a structural change to the timeline. The second is a marginal improvement to a single boundary.
This is still a big gap when attackers are using AI to develop exploits effectively immediately after a patch is released, which is what we are beginning to see.
This observation has real implications for strategy. Organizations that are able to identify and remediate their own vulnerabilities automatically using the same AI capabilities as attackers reduce the need to enter the patch cycle. Using automation and AI to improve patch assessment, testing, and deployment further compresses the exposure window. These are some of the founding principles of VulnOps, a function staffed and automated like DevOps but built for autonomous vulnerability research and remediation, which we described in the Mythos Ready paper.
However, the reality is that most organizations aren’t even close to capable of patching without some level of exposure window, due to all the constraints we covered earlier (legacy systems, etc).
10. The Connection to Zero Trust
Zero Trust architecture, from this model’s perspective, is the systematic application of path-deletion boundaries to create the sparsest possible attack graph. Zero Trust begins with an assumption: every connection and request is untrusted unless explicitly authorized, and this is enforced with identity and network boundaries. This transforms the environment from mesh topology (all systems can connect unless blocked) to sparse topology (nothing connects unless allowed).
Mathematically, Zero Trust minimizes the attack graph by eliminating edges that don’t have a clear business requirement for connectivity or authority. If system A doesn’t need system B, Zero Trust removes the relevant network and identity paths. If workload A doesn’t need secret B, it removes the identity or authorization path. The path is deleted only when all relevant edge types are removed.
The effect is multiplicative. In a mesh network, the path count scales as N². In a properly implemented Zero Trust architecture, the path count scales closer to k² + Σ internal_paths, where k is the number of zones or policy domains. For a large organization moving from mesh to sparse topology, this can reduce the attack surface dramatically. The outer product (multiple paths) in the breach probability equation is compressed.
| However, Zero Trust implementation cost scales with ** | D | × | edges | **, the number of resources multiplied by the number of existing connections. A small organization with 100 systems and 500 existing connections faces a different implementation burden than a large organization with 10,000 systems and 100,000 connections. The larger organization faces years of architecture work, technology acquisition, testing, and training. |
In those cases, implementing just part of Zero Trust, like microsegmentation, can still result in significant benefit by adding network boundaries and minimizing blast radius.
And Zero Trust isn’t a one-and-done implementation. As D grows with new systems and services, new connections are added to the graph. If an organization adds 100 new cloud services in a year, the attack graph expands. Zero Trust must be continuously applied to new resources, or the benefit degrades. This is an ongoing operational cost, not a one-time investment.
11. The Optimal Defensive Strategy
The scaling model yields a strategic priority ordering, but the order is conditional. Importantly, the two top-tier moves run in parallel, not in sequence. They’re owned by different teams, on different timelines, against different parts of the problem. They don’t compete for the same resources, and one rarely blocks the other. The rest of the list is supporting work.
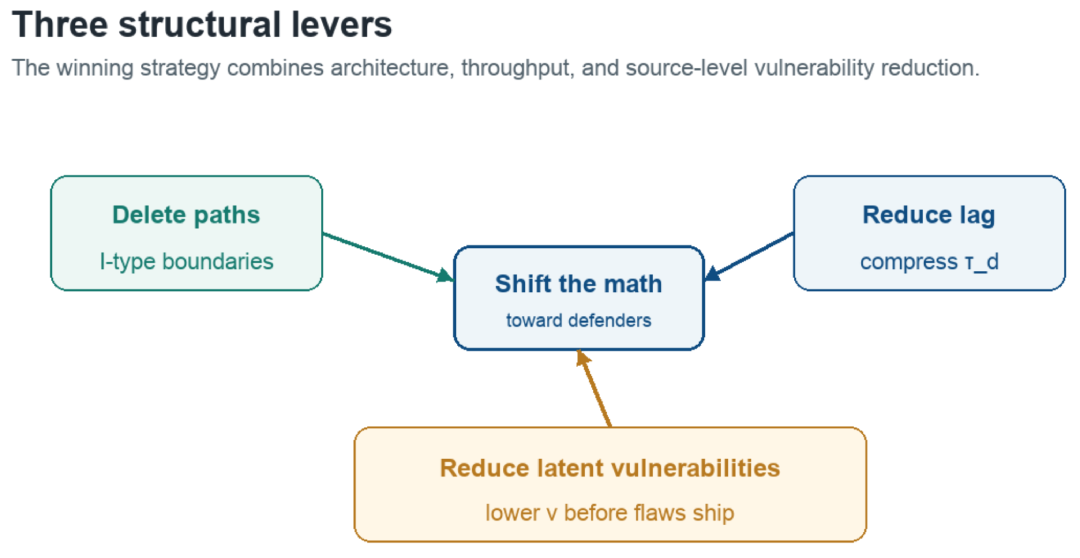
Priority 1 (Parallel): Reduce Institutional Lag (τ_d), Maximize Path-Deletion Boundaries (I-type), and Reduce Latent Vulnerabilities (ν)
These are the structural levers, and most organizations should pursue them at the same time. Different teams own them.
Maximize Path-Deletion Boundaries (I-type). Owned by security architecture and the platform/network teams that operate the production environment. Path-deletion boundaries operate at the OR level of the attack graph. They remove edges rather than make them harder, though only for the edge types they cover. The work is network segmentation, privilege isolation, application sandboxing, workload identity, SaaS control-plane hardening, and decomposition into zones. Migrating to cloud can speed this process due to the inherent software defined networks and infrastructure, but only if you refactor while relocating. The goal isn’t a segmented-looking diagram. It’s removing reachable paths to objectives. Path deletion compounds. Every future incident has a smaller blast radius because of it.
Reduce Institutional Lag (τ_d). Owned by application engineering, platform teams, and vulnerability management. Implement VulnOps. Streamline change management, reduce approval cycles, automate testing, and trust the deployment processes you build. Compressing τ_d from 60 days to 1 day may prevent more breaches than any new technology because it directly addresses the vulnerability window. In the Mythos/Glasswing era, this is the difference between AI producing useful fixes and AI producing a very expensive backlog. This requires organizational discipline and risk acceptance. It likely requires the integration of AI and automation into existing tooling.
Reduce Latent Vulnerabilities (ν). Owned by application engineering and whoever writes the code. Use AI to find and fix vulnerabilities during development, before they ever ship: AI-assisted code review at commit time, secure-by-default frameworks and IaC, memory-safe languages, and automated analysis built into the pipeline. This is the only lever that shrinks the vulnerable surface at the source rather than managing it after the fact. The catch is that it applies mainly to organizations that write their own software, which seems to be growing daily thanks to vibe coding.
Conventional security wisdom puts architecture first and process improvements later. This model treats them as parallel because they really are parallel. Running one well doesn’t substitute for running the others. A fast-remediating organization with mediocre isolation gets breached and contains it quickly. A beautifully segmented organization with 90-day patching gets breached anyway and has more time to be exploited. You want all of them moving. Still, each does different work: path deletion changes which way the math points, lag reduction changes how fast you lose within whatever structure you have, and reducing latent vulnerabilities drains the surface that feeds every attack.
Priority 2: Strengthen Inline Boundaries on Remaining Paths (L-type)
Once path-deletion has reduced unnecessary paths, harden the defenses on the paths that remain. Multi-factor authentication, encryption in transit and at rest, endpoint protection, and configuration hardening. These defenses are multiplicative along each path. They’re less impactful than true path deletion, but they reduce bypass probability on what’s left.
Defense in breadth is not defense in depth: inline boundaries only increase attacker costs when they must be defeated one at a time, in order.
Priority 3: Deploy Detective Boundaries (D-type)
While planning and implementing structural changes, deploy detective boundaries to tax the attacker’s selection and reconnaissance phase. Honeypots, deception networks, and canary tokens create friction in the OR level without architectural redesign. They work best when they’re high-fidelity, varied, and tied to telemetry that turns attacker validation into defender advantage.
Honestly, these can also be created in parallel with path deletion and patch lag reduction.
Priority 4: Invest in Graph Enumeration
The attacker’s selection function depends on enumerating the target landscape and identifying exploitable paths. The defender should enumerate their own attack graph better than the attacker. Regular adversarial assessments, penetration testing, vulnerability scanning, identity review, dependency analysis, and architecture review help the defender understand which paths and cut sets matter most. This intelligence drives prioritization for everything above and is optimal for defender use of AI.
12. Conclusion: The Structural Nature of Asymmetry
The attacker-defender asymmetry in cybersecurity is structural. Attackers have a bounded search problem: find one working path in a space of their choosing. Defenders have a combinatorial complexity problem: defend all resources from all potential exploits from all potential attackers for all time. This asymmetry exists regardless of tool capability, organizational maturity, or talent. It’s mathematical, and the math currently favors attackers.
The scaling model formalizes the asymmetry using the OR-of-ANDs structure of breach probability. It shows that three of four levels in the attack graph favor attackers, that the attacker’s problem space shrinks with their selection, and that the defender’s problem space grows with inherited infrastructure and dependencies.
It identifies the three mechanisms available to defenders (Transfer, Reduction, and Isolation) for structurally bounding the problem. Even aggressive application of all three leaves a residual core best measured by risk-weighted paths rather than raw surface area. None of these variables are precisely measurable. The model is in the same family as the Drake Equation: a tool for thinking about relationships, not for computing numbers. What it gives you is direction: which way the inequalities point and what changes them.
AI is changing cybersecurity, but not symmetrically. It accelerates the attacker’s selection and execution, erodes the differentiated-versus-undifferentiated distinction, lowers the skill floor so more attackers can operate like experts, and enables continuous automated operation. Within the discovery-to-remediation pipeline it shifts the binding constraint from finding vulnerabilities to shipping the fix. Initiatives like RAPTOR demonstrate the known-vulnerability side of this shift; Mythos and Glasswing demonstrate the latent-vulnerability side.
For defenders, AI improves detection and response speed and, in the hands of software producers, can compress the effective vulnerable surface by discovering latent bugs before attackers weaponize them. Over time, that effect should grow: as more software passes through automated vulnerability analysis during development, the ν term (the influx of new exploitable flaws in newly-written code) should keep falling.
The catch is that the legacy stack doesn’t benefit at the same rate. Older software that can’t easily be patched without breaking production stays where it is. The forward-looking compression of L and the backward-looking persistence of legacy V_e will coexist for a long time. Meanwhile, the supply chain amplifies the structural imbalance for everyone: attackers conduct bounded searches against widely-used open source projects while defenders face risk-weighted coverage of their dependency graph.
The deepest insight from the model is not about speed. It is about complexity. The defender’s most powerful move is to raise the attacker’s complexity by adding boundaries that delete paths. Every path you remove forces the attacker to find another, and a well-bounded environment turns their clean bounded-search problem into the same combinatorial complexity problem the defender has lived with all along. Reducing institutional lag matters, and it matters a great deal, but on its own faster patching just helps you lose more slowly. Boundaries change which side the math favors.
The deepest insight from the model is not about speed. It is about complexity. The defender’s most powerful move is to raise the attacker’s complexity by adding boundaries that delete paths.
This is why the winning strategy is a combination. Boundaries change the structure. Lag reduction closes the window on whatever paths survive. AI turned on your own code during development slowly drains the vulnerable surface that feeds every attack. Each one alone is a partial measure. Run together, they compound in the defender’s favor the way the attacker’s advantages compound today.
The hard part is timing. Boundaries can be expensive and slow to stand up, lag reduction takes organizational discipline more than new tools, and the vulnerability drain is a long game. Defenders absorb the cost up front and only see the structural payoff later. That is the short-term pain the model predicts, but also the long-term advantage.
The optimal defensive strategy makes the sequential difficulty of traversing a single well-defended path the only game available to the attacker. That means deleting unnecessary paths through isolation, strengthening remaining paths through inline boundaries, maintaining reconnaissance friction through deception, executing structural changes at speed, and continuously enumerating the attack graph. It’s a matter of understanding the problem’s structure, increasing attacker complexity at every level you can reach, and building the organizational capability to actually execute and sustain the work.
None of this is permanent! As we integrate AI throughout software development we will be finding and fixing the vulnerabilities before they are ever released. The total number of existing and potential vulnerabilities will decrease. Even application level vulnerabilities like misconfigurations and logic flaws will be dramatically reduced by the deep integration of AI security agents into software development. The addition of security boundaries creates long-lasting security resilience, even when vulnerabilities are exploitable.
The attacker advantage is current, not eternal. The defender’s job is to drive the math toward equilibrium, and eventually past it.
Further Reading
Mogull, R. (2026). Core Collapse. Cloud Security Alliance.
Mogull, R. (2009). The Data Breach Triangle. Securosis.
Farris, C., & Mogull, R. (2024). The Universal Cloud Threat Model. PrimeHarbor & Securosis.
Evron, G. (2025). RAPTOR: An agentic AI offensive and defensive security framework. GitHub.
Waldman, A. (2025). New Raptor framework uses agentic workflows to create patches. Dark Reading.
Anthropic. (2026). Project Glasswing: Securing critical software for the AI era.
Anthropic Frontier Red Team. (2026). Claude Mythos Preview.
AI Security Institute. (2026). Our evaluation of Claude Mythos Preview’s cyber capabilities.
Mozilla Security Team. (2026). AI security, zero-day vulnerabilities, and Project Glasswing.
Rose, S., Borchert, O., Mitchell, S., & Connelly, S. (2020). Zero Trust Architecture (NIST SP 800-207). National Institute of Standards and Technology.
Lanchester, F. W. (1916). *Aircraft in Warfare: The Dawn of the Fourth Arm.* Constable.
Shannon, C. E. (1948). A Mathematical Theory of Communication. *The Bell System Technical Journal, 27*(3), 379–423.