Systems Analysis for Zero Trust: Understand How Your System Operates
Published 12/05/2024
If you’re excited about building a Zero Trust architecture for your organization, we understand! Zero Trust is pretty much the ultimate security strategy. However, before diving headfirst into building out your architecture, you need to perform a comprehensive systems analysis.
This analysis should cover the functions and interactions of all devices, assets, applications, and services (DAAS) in the system. You must understand how your system accesses, processes, transmits, and shares data across various components. After correlating the information from your analysis, you can create a complete data flow mapping for your business systems. This is the first, critical step to ensuring robust data protection.
Below, get a high-level understanding of how to perform a systems analysis. We'll cover how both existing resources and innovative tools come into play.
Preparing for a Systems Analysis
Before starting your analysis, make sure to:
- Define the Protect Surface: Identify the existing system’s assets. Determine how critical each asset is to the business and classify its risk.
- Validate the Protect Surface’s DAAS elements: Validate the completeness and role of the system’s elements.
- Identify business system users: Understand all internal and external stakeholders of the Protect Surface. This includes internal users, customers, third-party service providers, suppliers, contractors, guest users, and so on.
- Identify dependencies and interactions: Thoroughly analyze system operations, processes, the flow of data, and relationships that interact with the business system’s DAAS elements. This includes identifying all non-human identities that have access to and interact with the Protect Surface.
Creating and Leveraging System Artifacts
You should base your systems analysis on a set of existing or net new artifacts. These include architecture diagrams, network diagrams, user interaction diagrams, and data mapping diagrams. Create these diagrams by engaging with various stakeholders across the network, application, and business teams.
User Interaction Diagrams
User interaction diagrams illustrate how users interact with the system. They should include user actions, input/output data, and user interface components. Understanding user interactions is crucial for mapping end-to-end flows.
Network Diagrams
Network diagrams visualize the network topology. They highlight physical and logical connections between various DAAS elements like servers and network devices.
Application Architecture Documentation
Application architecture diagrams provide an understanding of the software system structure. This includes placing assets, resources, data, and services. They also explain how critical components like databases, APIs, and user interfaces interact during a transaction flow.
Over the past few years, application architectures have transformed from monolithic designs to more modular and distributed approaches. These include microservices, containers, and serverless computing.
Modern applications often employ multi-tier architectures (N-tier architecture), distributing the functionality across multiple layers. Analyzing these architectures requires a thorough understanding of how each tier accesses and manipulates data. When mapping transaction flows in a multi-tier architecture, it is important to consider the following aspects:
- Data flow between tiers: Understand how data is passed between the presentation, business logic, and data tiers. Identify the protocols and formats used for communication.
- Data transformation and validation: Analyze how each tier transforms, validates, and processes data. Identify any data manipulation, formatting, or enrichment at each layer.
- Access controls and authentication: Assess each tier's access controls and authentication mechanisms. Ensure that proper authentication and authorization checks are in place.
- Error handling and exception management: Examine how each tier handles and propagates errors and exceptions. Identify any security vulnerabilities that may arise from improper error handling.
- Caching and data storage: Consider using caching mechanisms and data storage at each tier. Understand how the application caches, retrieves, and stores data and assess the security implications of these practices.
Data Flow Diagrams
Create a data flow diagram that contains:
- Transactional data flows
- Data transformations
- Data storage locations
- Data exchanges between system components and users
These diagrams highlight data inputs, outputs, transformations, and data dependencies critical for transaction processing.
While analyzing the data flow, it's essential to understand the data access methods. This involves thoroughly analyzing the system architecture, code base, and data flow patterns. Some common data access methods include:
- Application Programming Interfaces (APIs)
- Direct interaction with databases or unstructured data stores
- Others, e.g., file-based interfaces, message queues, or event-streaming platforms
API Documentation
You can use application documentation to understand how external systems or users interact with the system.
Resiliency/Business Continuity/Disaster Recovery Plans
Make sure to identify:
- Which DAAS elements are primary production instances
- Which DAAS elements are backup/disaster recovery instances that help provide resiliency
- Which DAAS elements represent single points of failure
- Which DAAS elements are development/test instances
- Associated data flows in the system, including data and system backups, alternate transaction flows associated with disaster recovery instances and operations, etc.
Using the Artifacts Together
Here’s an example of how you could use your various system artifacts together:
- Determine transaction entry and exit points within and outside the business information system. These could be services, user interfaces, APIs, or other interaction points.
- Use the flow diagram to trace the flow through the system. Identify the services and processes for handling transactions and their interactions with other entities and data.
- Identify the DAAS elements accessed and their roles in the transaction using the architecture diagram.
- Use the network diagram to identify how the transaction's access to DAAS elements is designed. Identify protocols, channels, and payloads.
Leveraging Scanning and Monitoring Tools
You can use various tools to discover and map devices, services, and information flows. These tools identify all active connected devices, ports, hosts, operating systems, and traffic for a business information system. You can use a combination of information collected from these tools to gain insights into transaction flows.
Ensuring proper placement and coverage of your scanning and monitoring tools guarantees a comprehensive insight into your environment. The table below lists a few tools and discusses how to use them in your systems analysis.
Tool type | Purpose | Data | Usage |
Application Observability and Analysis (Jaeger, Fluentd, Prometheus, OpenTelemetry) | Understand the system from its external outputs. | 1. Tracing data 2. Performance metrics | Collect telemetry data to aid in querying or visualizing data. |
Log Analysis (Splunk, ELK Stack, Sumo Logic) | Collect, centralize, and analyze log data from applications, servers, and network devices. | 1. User activities 2. Log events | Identify application errors, exceptions, and issues. |
API Monitoring (Postman, Apigee, Kong, Layer7 API Gateway) | Track and monitor interactions between applications, APIs, microservices, and external systems. | 1. API calls 2. API status 3. Usage analytics | Monitor API availability, track API usage, and identify API usage trends. |
Network Monitoring (Wireshark, Nagios, SolarWinds Network, Service Mesh Tools, Identity Aware Proxies) | Capture and analyze network traffic, including application-level protocols, to monitor system interactions and data exchanges. | 1. Network traffic data 2. Network device status 3. Service-level communication | Visualize network traffic flows, identify system communication patterns, and monitor service availability. |
Database Monitoring (SolarWinds Database Performance Analyzer, Oracle Enterprise Manager, SQL Sentry) | Monitor database performance, query execution, and data access patterns to capture interactions with database systems. | 1. Database server logs and events 2. Performance metrics 3. Session information | Analyze database transactions, data access patterns, and resource use. |
Application/Transaction Monitoring (Dynatrace Transaction Monitoring, AppDynamics Business iQ, Service Mesh) | Track end-to-end transactional workflows, identify transaction paths, and monitor transaction performance. | 1. Transaction traces 2. Business transaction data 3. Transaction performance metrics | Analyze user interactions and the business impact of transactional activities. |
Container Monitoring (Calico/Cillium, Network Policies, Runtime Monitoring) | Track container traffic, transactions, and interactions within the container ecosystem. | 1. Transaction traces 2. Network traffic data type 3. Service definitions and labels | Map DAAS transactions and dependencies. |
Learn More
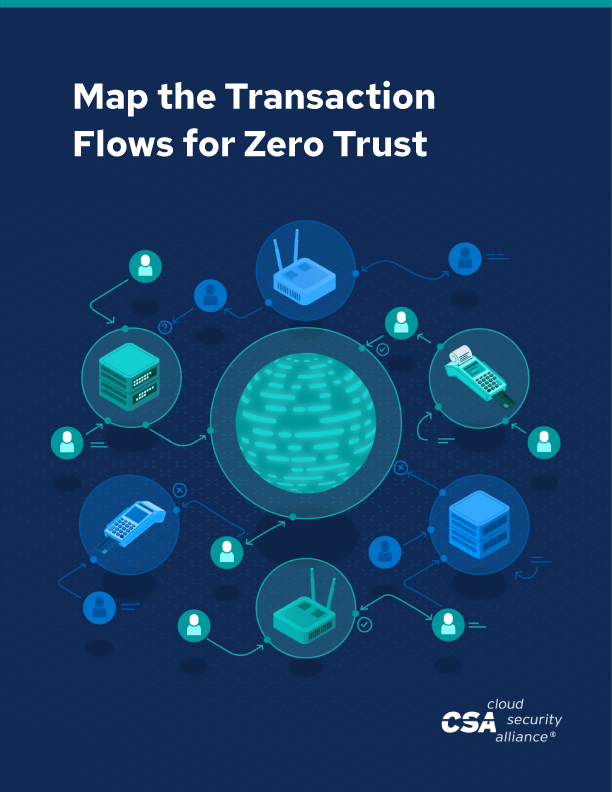
Preparing and implementing a Zero Trust strategy requires a lot more than we can cover in this blog. Get a thorough understanding of the beginning of the process by checking out Defining the Zero Trust Protect Surface. Then, dive deeper into the analysis process outlined in this blog by reading Map the Transaction Flows for Zero Trust.
Unlock Cloud Security Insights
Subscribe to our newsletter for the latest expert trends and updates
Related Articles:
Attackers Don’t Need Zero-Days When Cloud Misconfigurations Are Everywhere
Published: 04/29/2026
Identity and Authorization: The Operating System for AI Security
Published: 04/29/2026
From Cloud to AI: Building Security Programs That Scale
Published: 04/24/2026
Rethinking Incident Response as an Engineering System: Addressing 7 Operational Gaps
Published: 04/23/2026


